quantrr is a streamlined, opinionated, “risk quant on rails” tool designed to make it easy to get started with quantifying risk using R, first presented as a demo in my 2024 SIRAcon talk, “UnFAIR: Simplifying and Expanding Technology Risk Quantification.” quantrr includes functions and a report template that uses data from an Excel spreadsheet to forecast one or more risks related to a technology system, such as the risk of a cybersecurity breach and the risk of unplanned outages.
I originally wanted to name it “qrisk”, but that’s already trademarked.
quantrr can be installed as a standalone application (for novice users) or integrated into your R development workflow (for advanced users). Rendered versions of the standalone example reports are available here.
Standalone
The “standalone” version of quantrr provides all the files needed to create reports using quantrr, and is intended for those who want to get started quickly, or are new to R and don’t have an existing development and publishing workflow. The standalone version requires R and Quarto.
Note that there are many ways to install and use R and Quarto to generate reports. The instructions here are designed to make it easy to get started with quantrr. For other approaches, consult the R and quarto documentation. My setup is documented in rdev.
Install - Windows
To install the standalone version of quantrr on Windows:
- Download and install the latest version of R for Windows.
- Download and install Quarto CLI.
- From the “code” menu at https://github.com/jabenninghoff/quantrr/, select “Download ZIP”.
- Extract the “standalone” directory from the ZIP file and move it to “Documents”
- Launch R, and run the following commands:
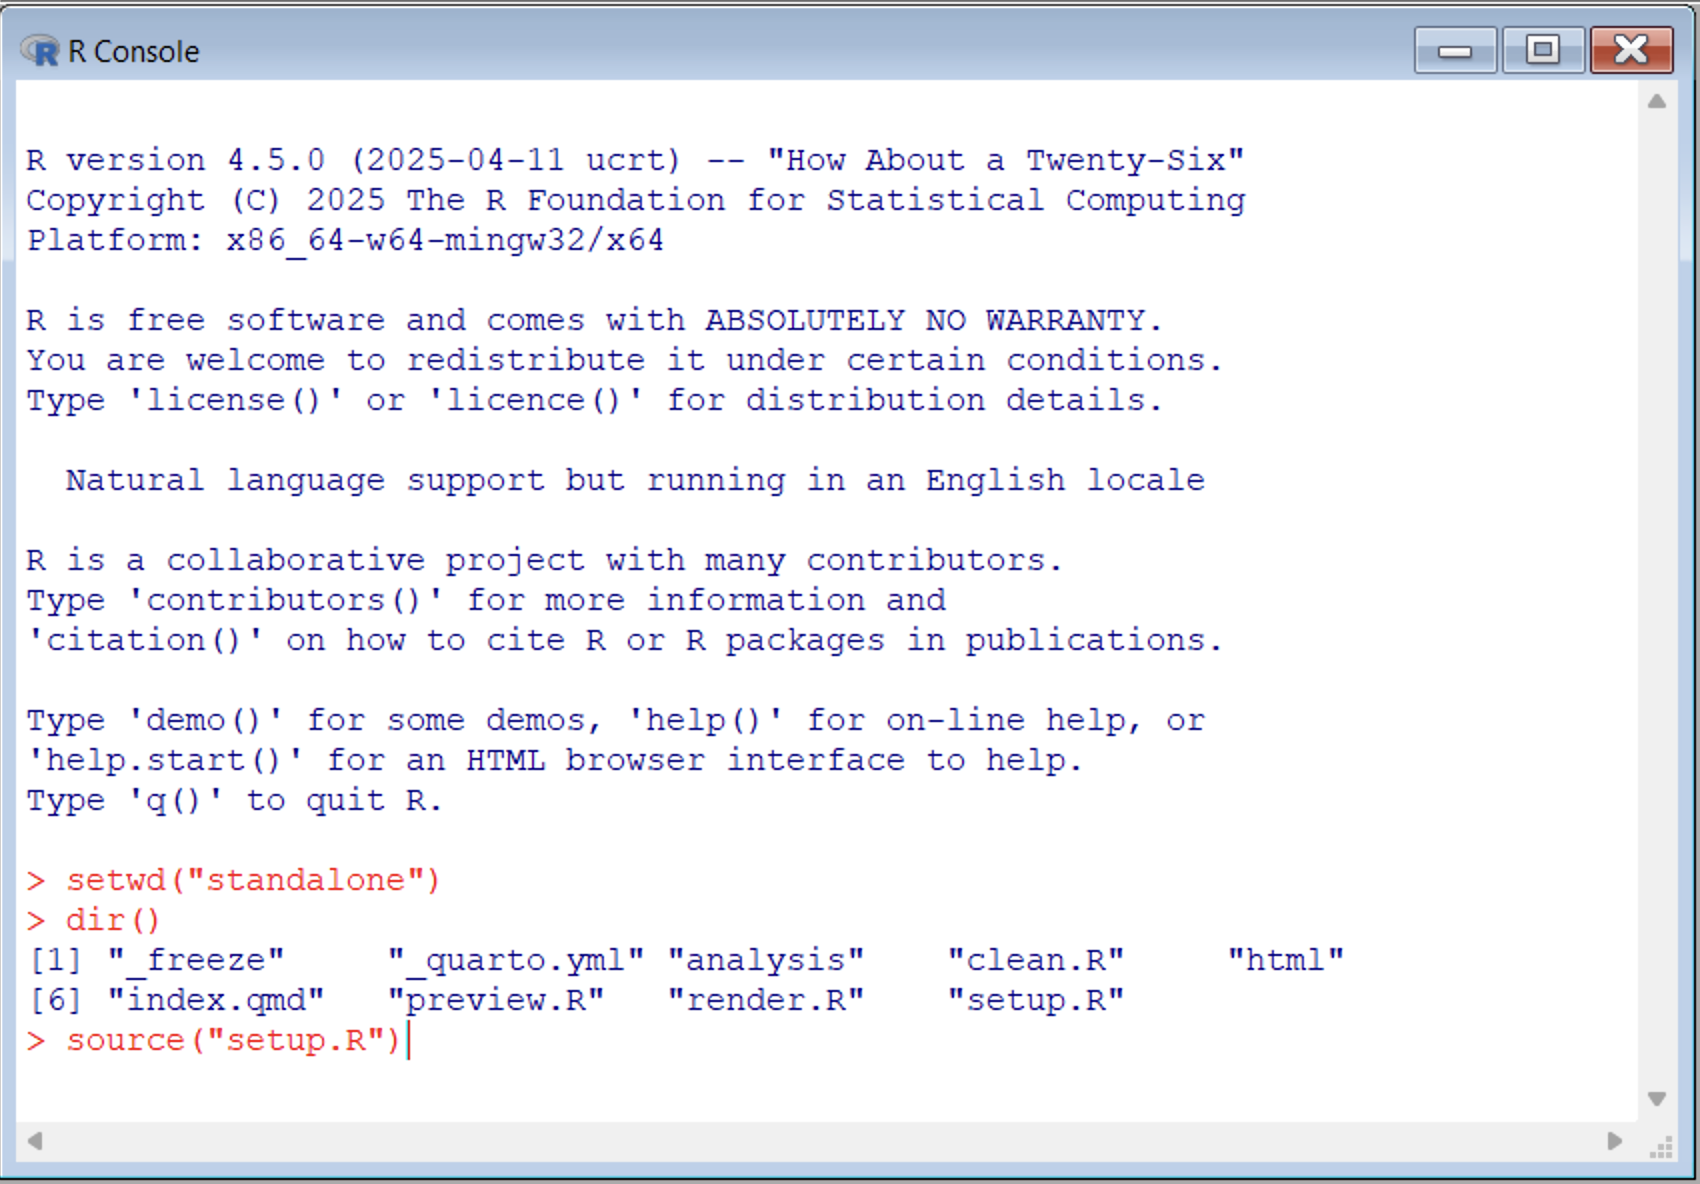
You should see the following in the R console before executing
source("setup.R"):

You may see some additional prompts: “Would you like to use a
personal library instead?” and “Would you like to create a personal
library
Install - macOS
To install the standalone version of quantrr on macOS:
- Download and install the latest version of R for macOS. Choose the appropriate version for your hardware (Apple silicon or Intel).
- Download and install Quarto CLI.
- From the “code” menu at https://github.com/jabenninghoff/quantrr/, select “Download ZIP”.
- Extract the “standalone” directory from the ZIP file and move it to
your home directory (“/Users/
”). - Launch R, and run the following commands:
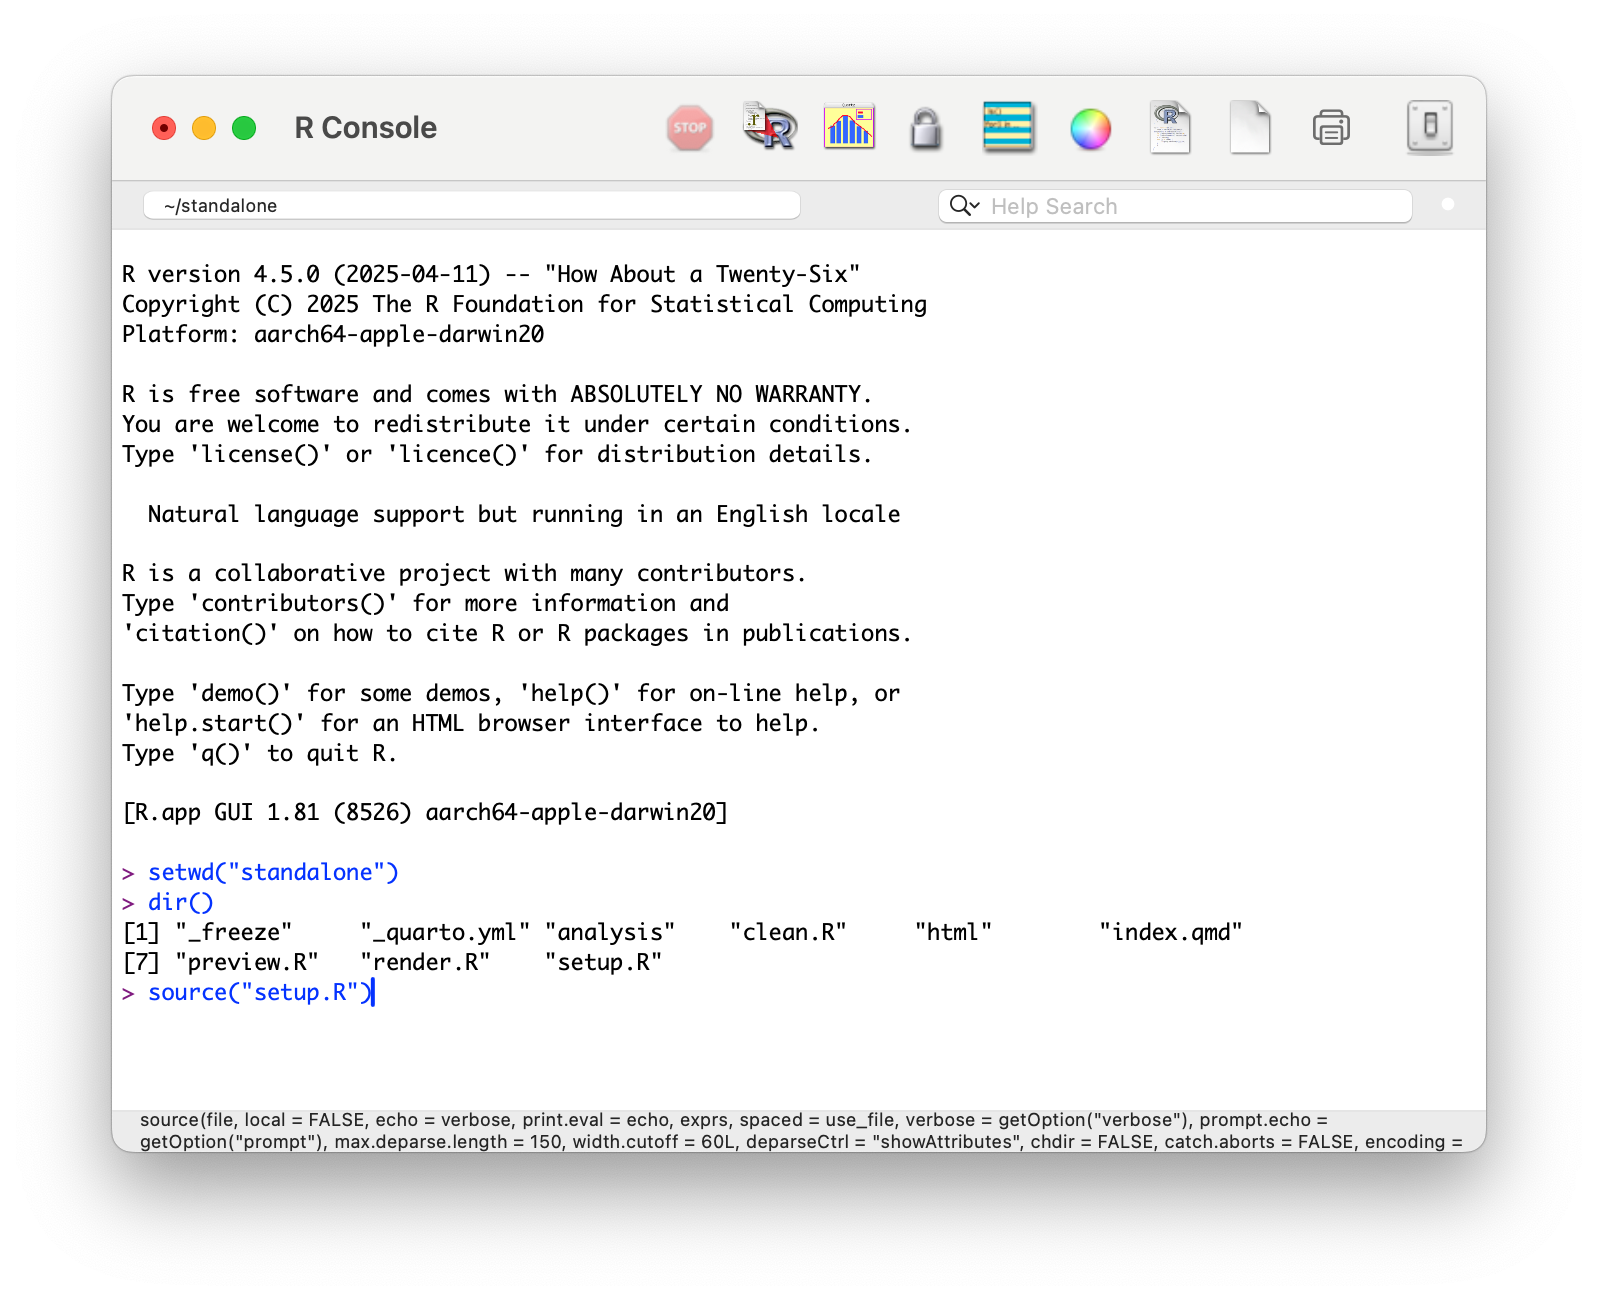
You should see the following in the R console before executing
source("setup.R"):

When prompted, choose a Secure CRAN mirror (“0-Cloud [https]”). If you are asked to install the command line developer tools, please do so.
Standalone Preview
The standalone version contains an example analysis for the “Widget Management System”. If everything is correctly installed, running the following command in the R Console will generate and launch a website locally on your system:
source("preview.R")Each time you launch R, you will need to set the working directory to
the standalone directory using setwd("standalone"). There
are three scripts you can use to build and manage the report:
-
source("preview.R")- generates and launches the report in a web browser -
source("render.R")- generates the report and saves it to the html directory -
source("clean.R")- deletes all quarto intermediate files and the html directory
Data Collection
Collect data using a copy of the widgetsys.xlsx
spreadsheet. The reporting tool uses only two tabs, “Risks” and
“Estimates”, all other tabs are ignored.
The Risks sheet is used for scoping the assessment, and has two columns:
- “Risk”, the short name of the risk, also used in the Estimates tab
- “Description”, the long description of the risk
There is no set limit on the number of risks, but each must be unique and there must be at least one risk.
The Treatments sheet is used for comparing investment (risk treatment) options, and has two columns:
- “Treatment”, the short name of the risk treatment, also used in the Estimates tab
- “Description”, the long description of the risk treatment
The Estimates sheet is used for gathering estimates from Subject Matter Experts, and has 7 columns:
- “Treatment”, the short name of the risk treatment, which must match one of the treatments in the Treatment tab
- “Risk”, the short name of the risk, which must match one of the risks in the Risk tab
- “Expert”, the name or identifier of the SME providing the estimate
- “Frequency (per year)”, the average number of times an event is expected to occur per year, used as the value of for the Poisson loss frequency distribution. Fractional values represent once every years; once every 4 years is 0.25.
- “Low (5%)”, the estimate of the low (5th percentile) value for a single loss event.
- “High (95%)”, the estimate of the high (95th percentile) value for a single loss event.
- “Most Likely”, the estimate of the median (50th percentile) value for a single loss event.
The Low and High values are used to calculate the parameters for the log-normal loss magnitude distribution, and the Most Likely is used as a check to see how close the estimates fit log-normal.
SMEs can provide estimates for one or more risks, and their estimates can be left blank. Typically this is because they have confidence in only the loss frequency or loss magnitude.
Reporting
To generate the report, copy or replace widgetsys.Rmd
with an updated value for report_file, and appropriate text
for the Environment Statement and Import sections. Generate and preview
html using Quarto:
For more information, see the Quarto documentation.
Integrated
The “integrated” version of quantrr consists of the quantrr package itself, and is intended for RStudio users who want to integrate it into their existing development and publishing workflow.
Installing
quantrr is not (yet) available on CRAN. You can install the development version of quantrr from GitHub using remotes:
# install.packages("remotes")
remotes::install_github("jabenninghoff/quantrr")
Or by using renv:
# install.packages("renv")
renv::install("jabenninghoff/quantrr")
quantrr includes common functions and an R Markdown template, “Risk Analysis Report”, that can be accessed in RStudio via File > New File > R Markdown… > From Template.
Data Collection
As noted above, use the widgetsys.xlsx spreadsheet as a
template for data collection.
Reporting
The “Risk Analysis Report” template works as an R Notebook in RStudio, and can be published using any system that supports R Markdown and HTML widgets (for the dynamic plots using plotly). I publish to GitHub Pages using rdev.
