library(hexSticker)
library(showtext)
library(tidyr)
library(ggplot2)
library(jbplot)Hex Stickers
stickers
Source code used to generate Hex Stickers for my R packages, using hexSticker.
Requires imageMagick, run: brew install imagemagick.
I used https://github.com/ryansafner/hexstickers as a reference to help get started with hexStickers.
rdev
Sticker for rdev.
Uses a modified version of the Wikimedia Commons Infinity in circle symbol to represent DevOps. The fill color is OSHA safety yellow.

font_add_google("Lato")
# TODO: understand why setting dpi = 600 and not dpi = 1200 correctly sizes the font
showtext_opts(dpi = 600)

sticker(
  "assets/infinity.png",
  s_x = 1,
  s_y = 0.7,
  s_width = 0.5,
  s_height = 0.5,
  package = "rdev",
  p_color = "black",
  p_family = "Lato",
  p_size = 28,
  h_fill = "#EAC234",
  h_color = "black",
  filename = "rendered/rdev.png",
  dpi = 1200
)
Rendered file:

jbplot
Sticker for jbplot.
First Version
The background of the sticker is a line plot with three colors using the viridis color map.
j_series <- c(1, 2, 3, 4, 5, 4, 5, 6, 7, 8)

jbplot_v1 <- data.frame(
  observation = 1:10,
  group_a = j_series - 1,
  group_b = j_series + 1,
  group_c = j_series + 3
) |>
  pivot_longer(!observation, names_to = "group") |>
  ggplot(aes(x = observation, y = value, color = group)) +
  geom_line() +
  geom_point() +
  labs(x = NULL, y = NULL) +
  guides(color = "none") +
  scale_x_continuous(labels = NULL) +
  scale_y_continuous(limits = c(-1, 12), labels = NULL) +
  scale_color_viridis_d() +
  theme_quo()

sticker(
  jbplot_v1,
  s_x = 1,
  s_y = 1,
  s_width = 2,
  s_height = 2.15,
  package = "jbplot",
  p_color = "gray50",
  p_family = "Lato",
  p_size = 24,
  h_fill = "white",
  h_color = "black",
  white_around_sticker = TRUE,
  filename = "rendered/jbplot_v1.png",
  dpi = 1200
)
Rendered file:
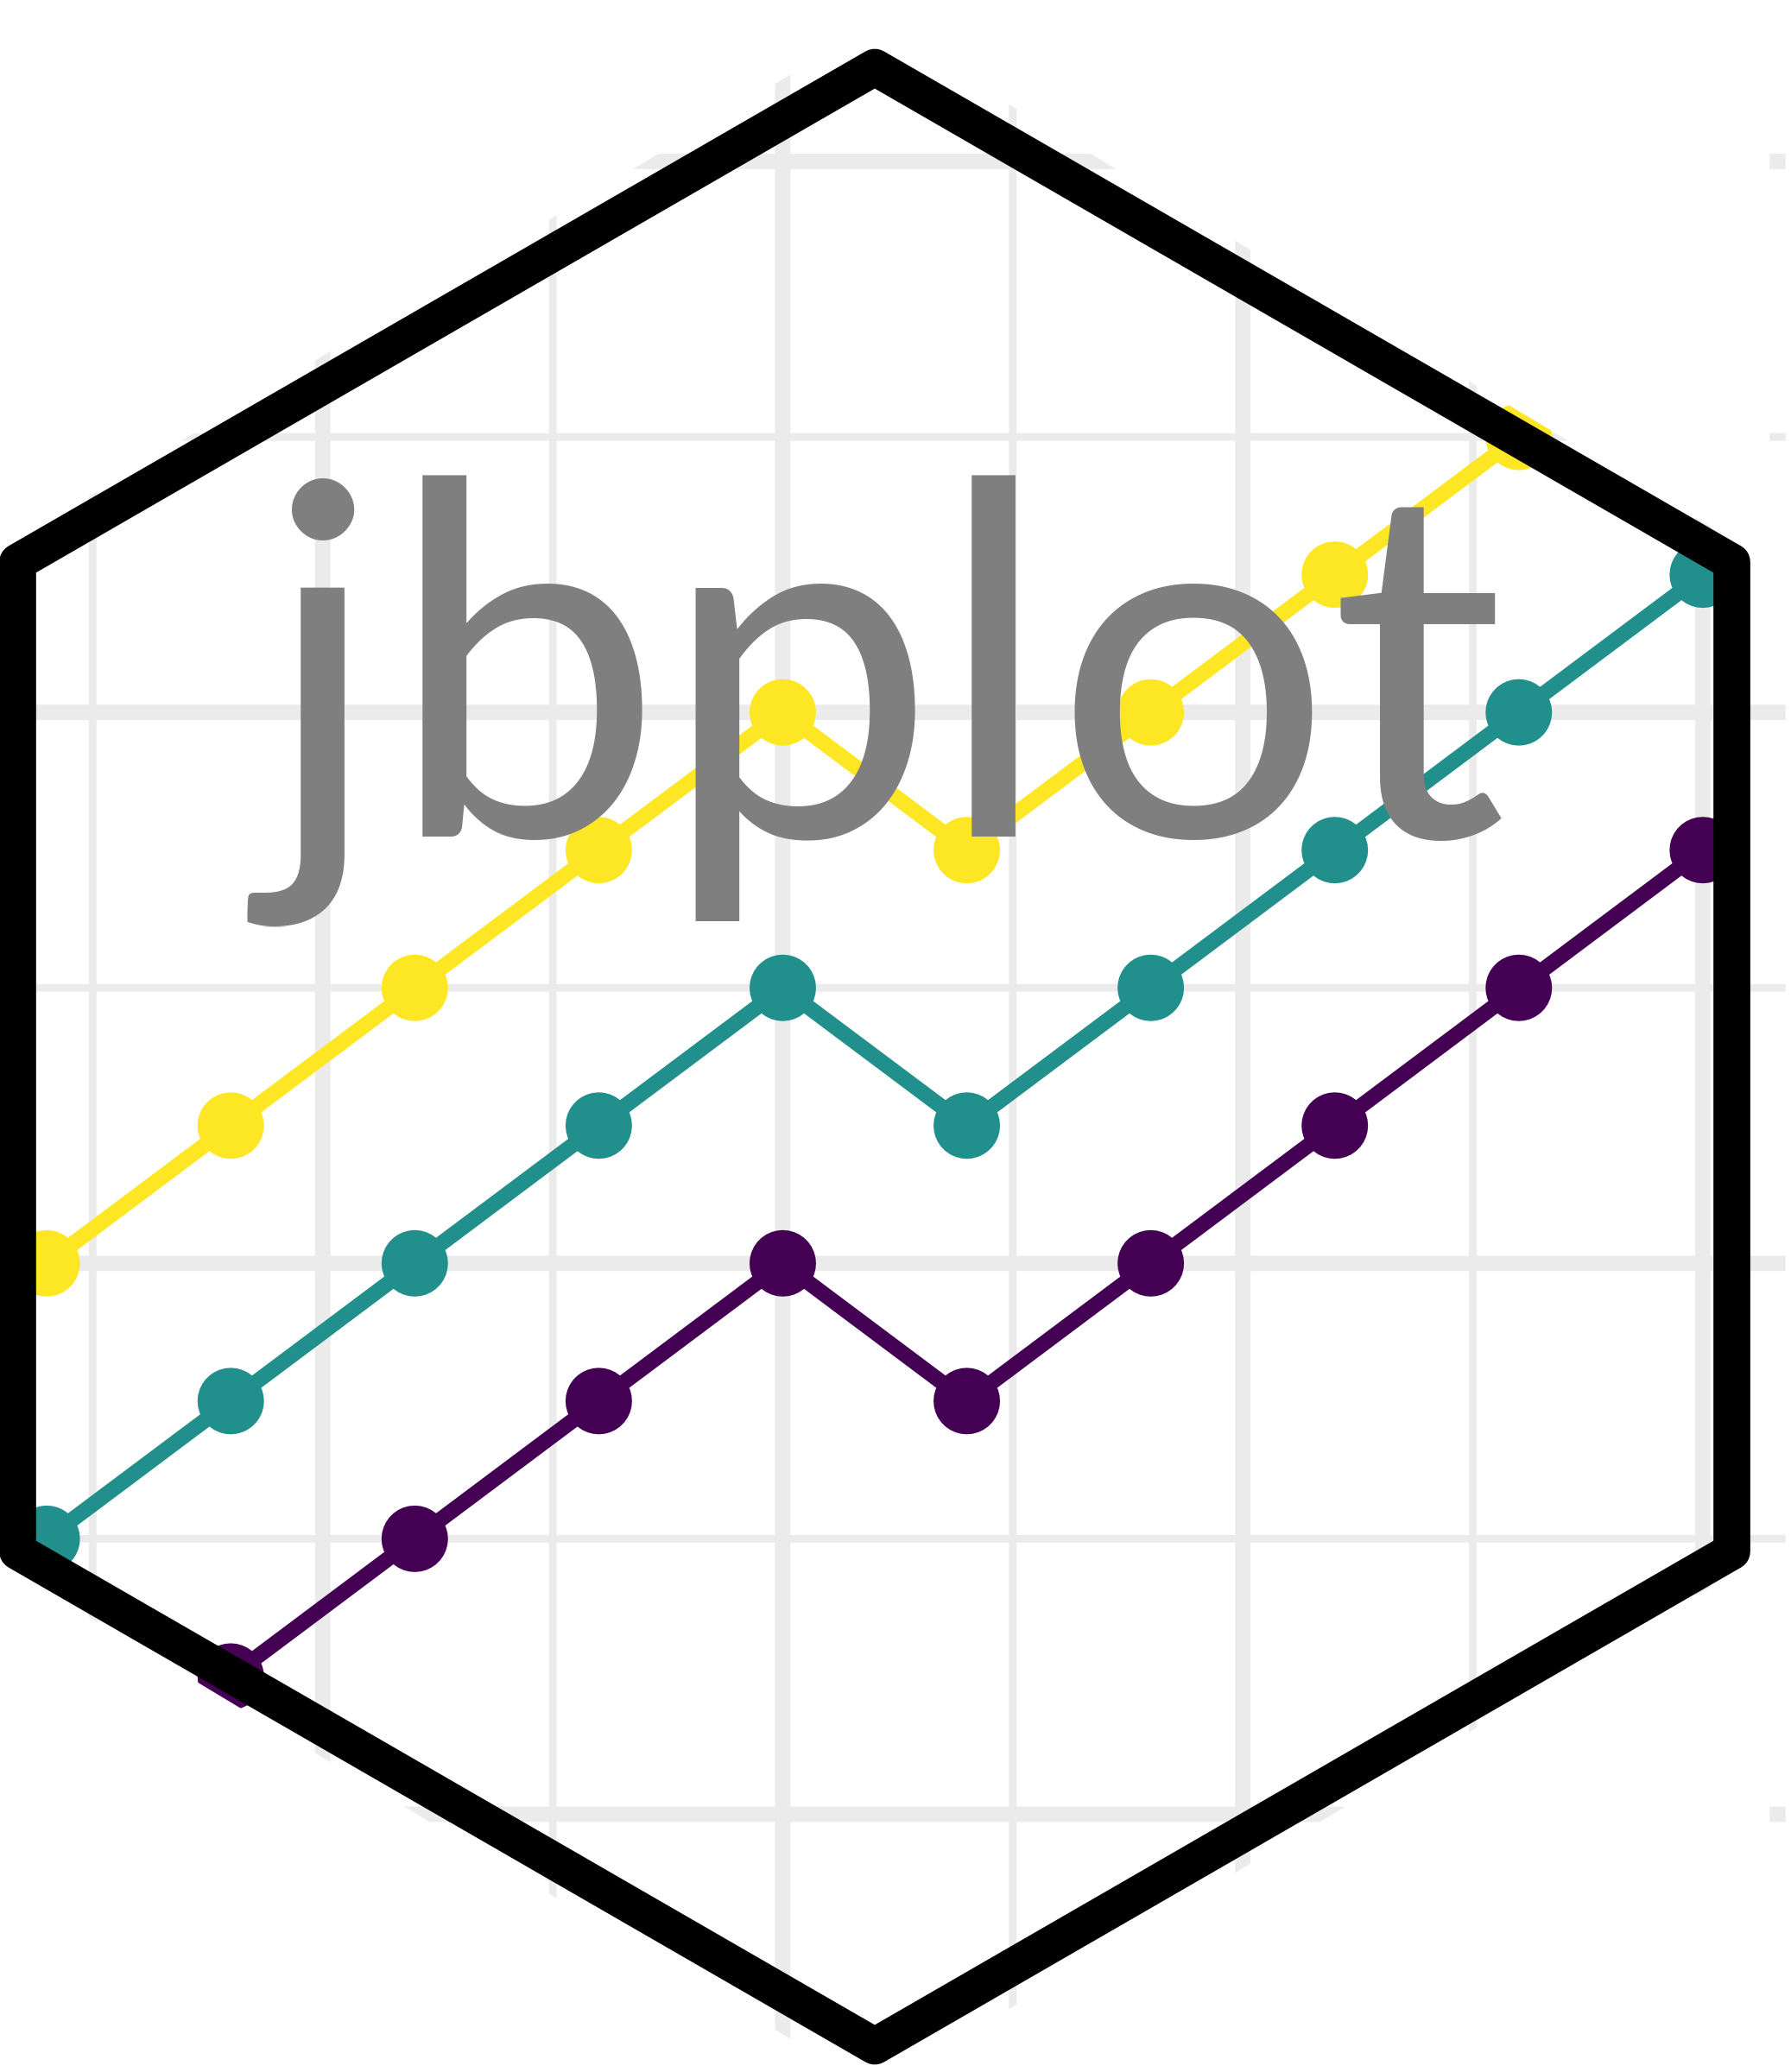
While this version is OK, it’s strangely unsatisfying.
Second Version
The second version uses a jbplot ggplot_donut() plot with the viridis color map.
jbplot <- data.frame(group = c("A", "B", "C"), n = c(4, 3, 2), stringsAsFactors = FALSE) |>
  ggplot_donut(hsize = 4) +
  scale_fill_viridis_d() +
  guides(fill = "none") +
  theme_transparent() +
  theme(plot.background = element_rect(linewidth = 0))

sticker(
  jbplot,
  s_x = 0.983,
  s_y = 0.6,
  s_width = 1.1,
  s_height = 1.1,
  package = "jbplot",
  p_color = "gray25",
  p_family = "Lato",
  p_size = 22,
  h_fill = "white",
  h_color = "gray50",
  filename = "rendered/jbplot.png",
  dpi = 1200
)
Rendered file:

The second version is more satisfying.
cards
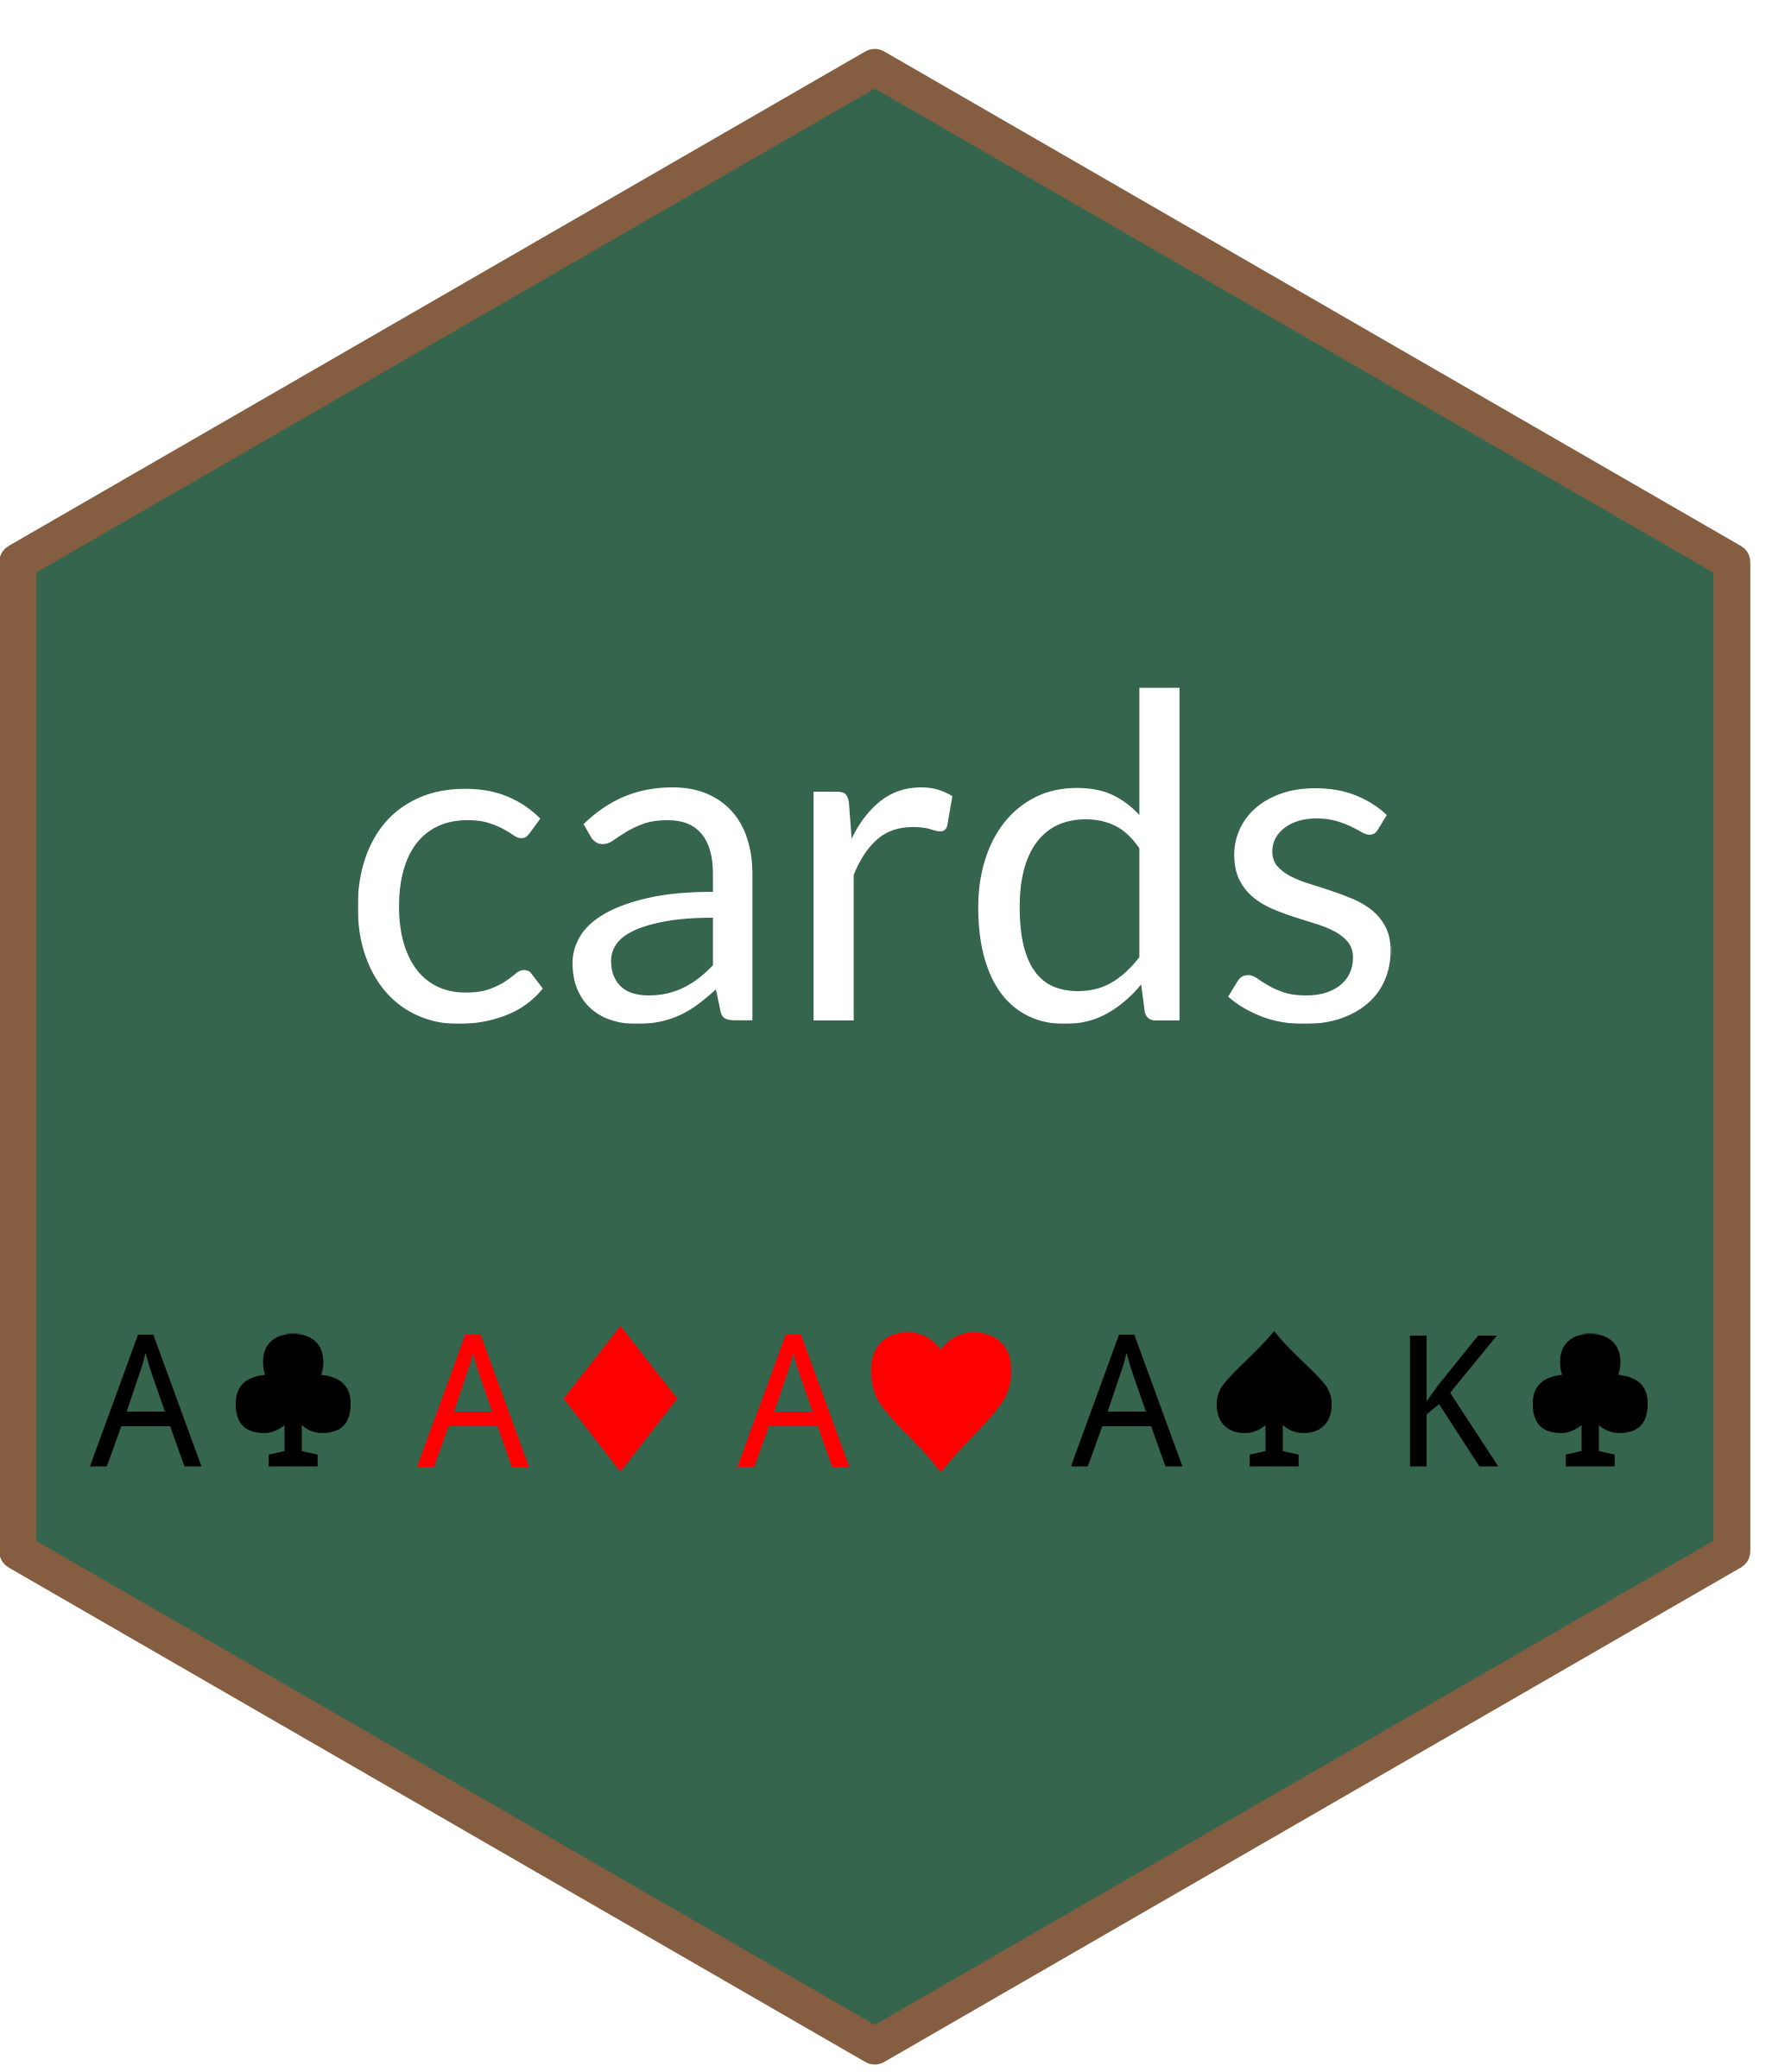
Sticker for cards. Uses ggplot2 text annotations with unicode card suits. The background is Poker Green and the border is Dark Wood.
c_size <- 9
cards <- ggplot() +
  annotate("text", x = 1, y = 0, label = "A\u2663", size = c_size) +
  annotate("text", x = 2, y = 0, label = "A\u2666", size = c_size, color = "red") +
  annotate("text", x = 3, y = 0, label = "A\u2665", size = c_size, color = "red") +
  annotate("text", x = 4, y = 0, label = "A\u2660", size = c_size) +
  annotate("text", x = 5, y = 0, label = "K\u2663", size = c_size) +
  scale_x_continuous(limits = c(0.25, 5.75)) +
  theme_void() +
  theme_transparent()

sticker(
  cards,
  s_x = 1,
  s_y = 0.65,
  s_width = 2,
  s_height = 2,
  package = "cards",
  p_y = 1.2,
  p_color = "#FFFFFF",
  p_family = "Lato",
  p_size = 22,
  h_fill = "#35654D",
  h_color = "#855E42",
  filename = "rendered/cards.png",
  dpi = 1200
)
Rendered file:
quantrr
Sticker for quantrr. Features an uppercase “Q” in the Metropolis font, rendered as a .png since Metropolis isn’t in Google Fonts. Blue Q, orange text, with a dark gray border and light gray background.
pal <- jbplot::differently_palettes$primary

sticker(
  "assets/q-logo.png",
  s_x = 1,
  s_y = 1.3,
  s_width = 0.5,
  s_height = 0.5,
  package = "quantrr",
  p_y = 0.7,
  p_color = pal[["orange"]],
  p_family = "Lato",
  p_size = 20,
  h_fill = pal[["lightgray"]],
  h_color = pal[["darkgray"]],
  filename = "rendered/quantrr.png",
  dpi = 1200
)
Rendered file:

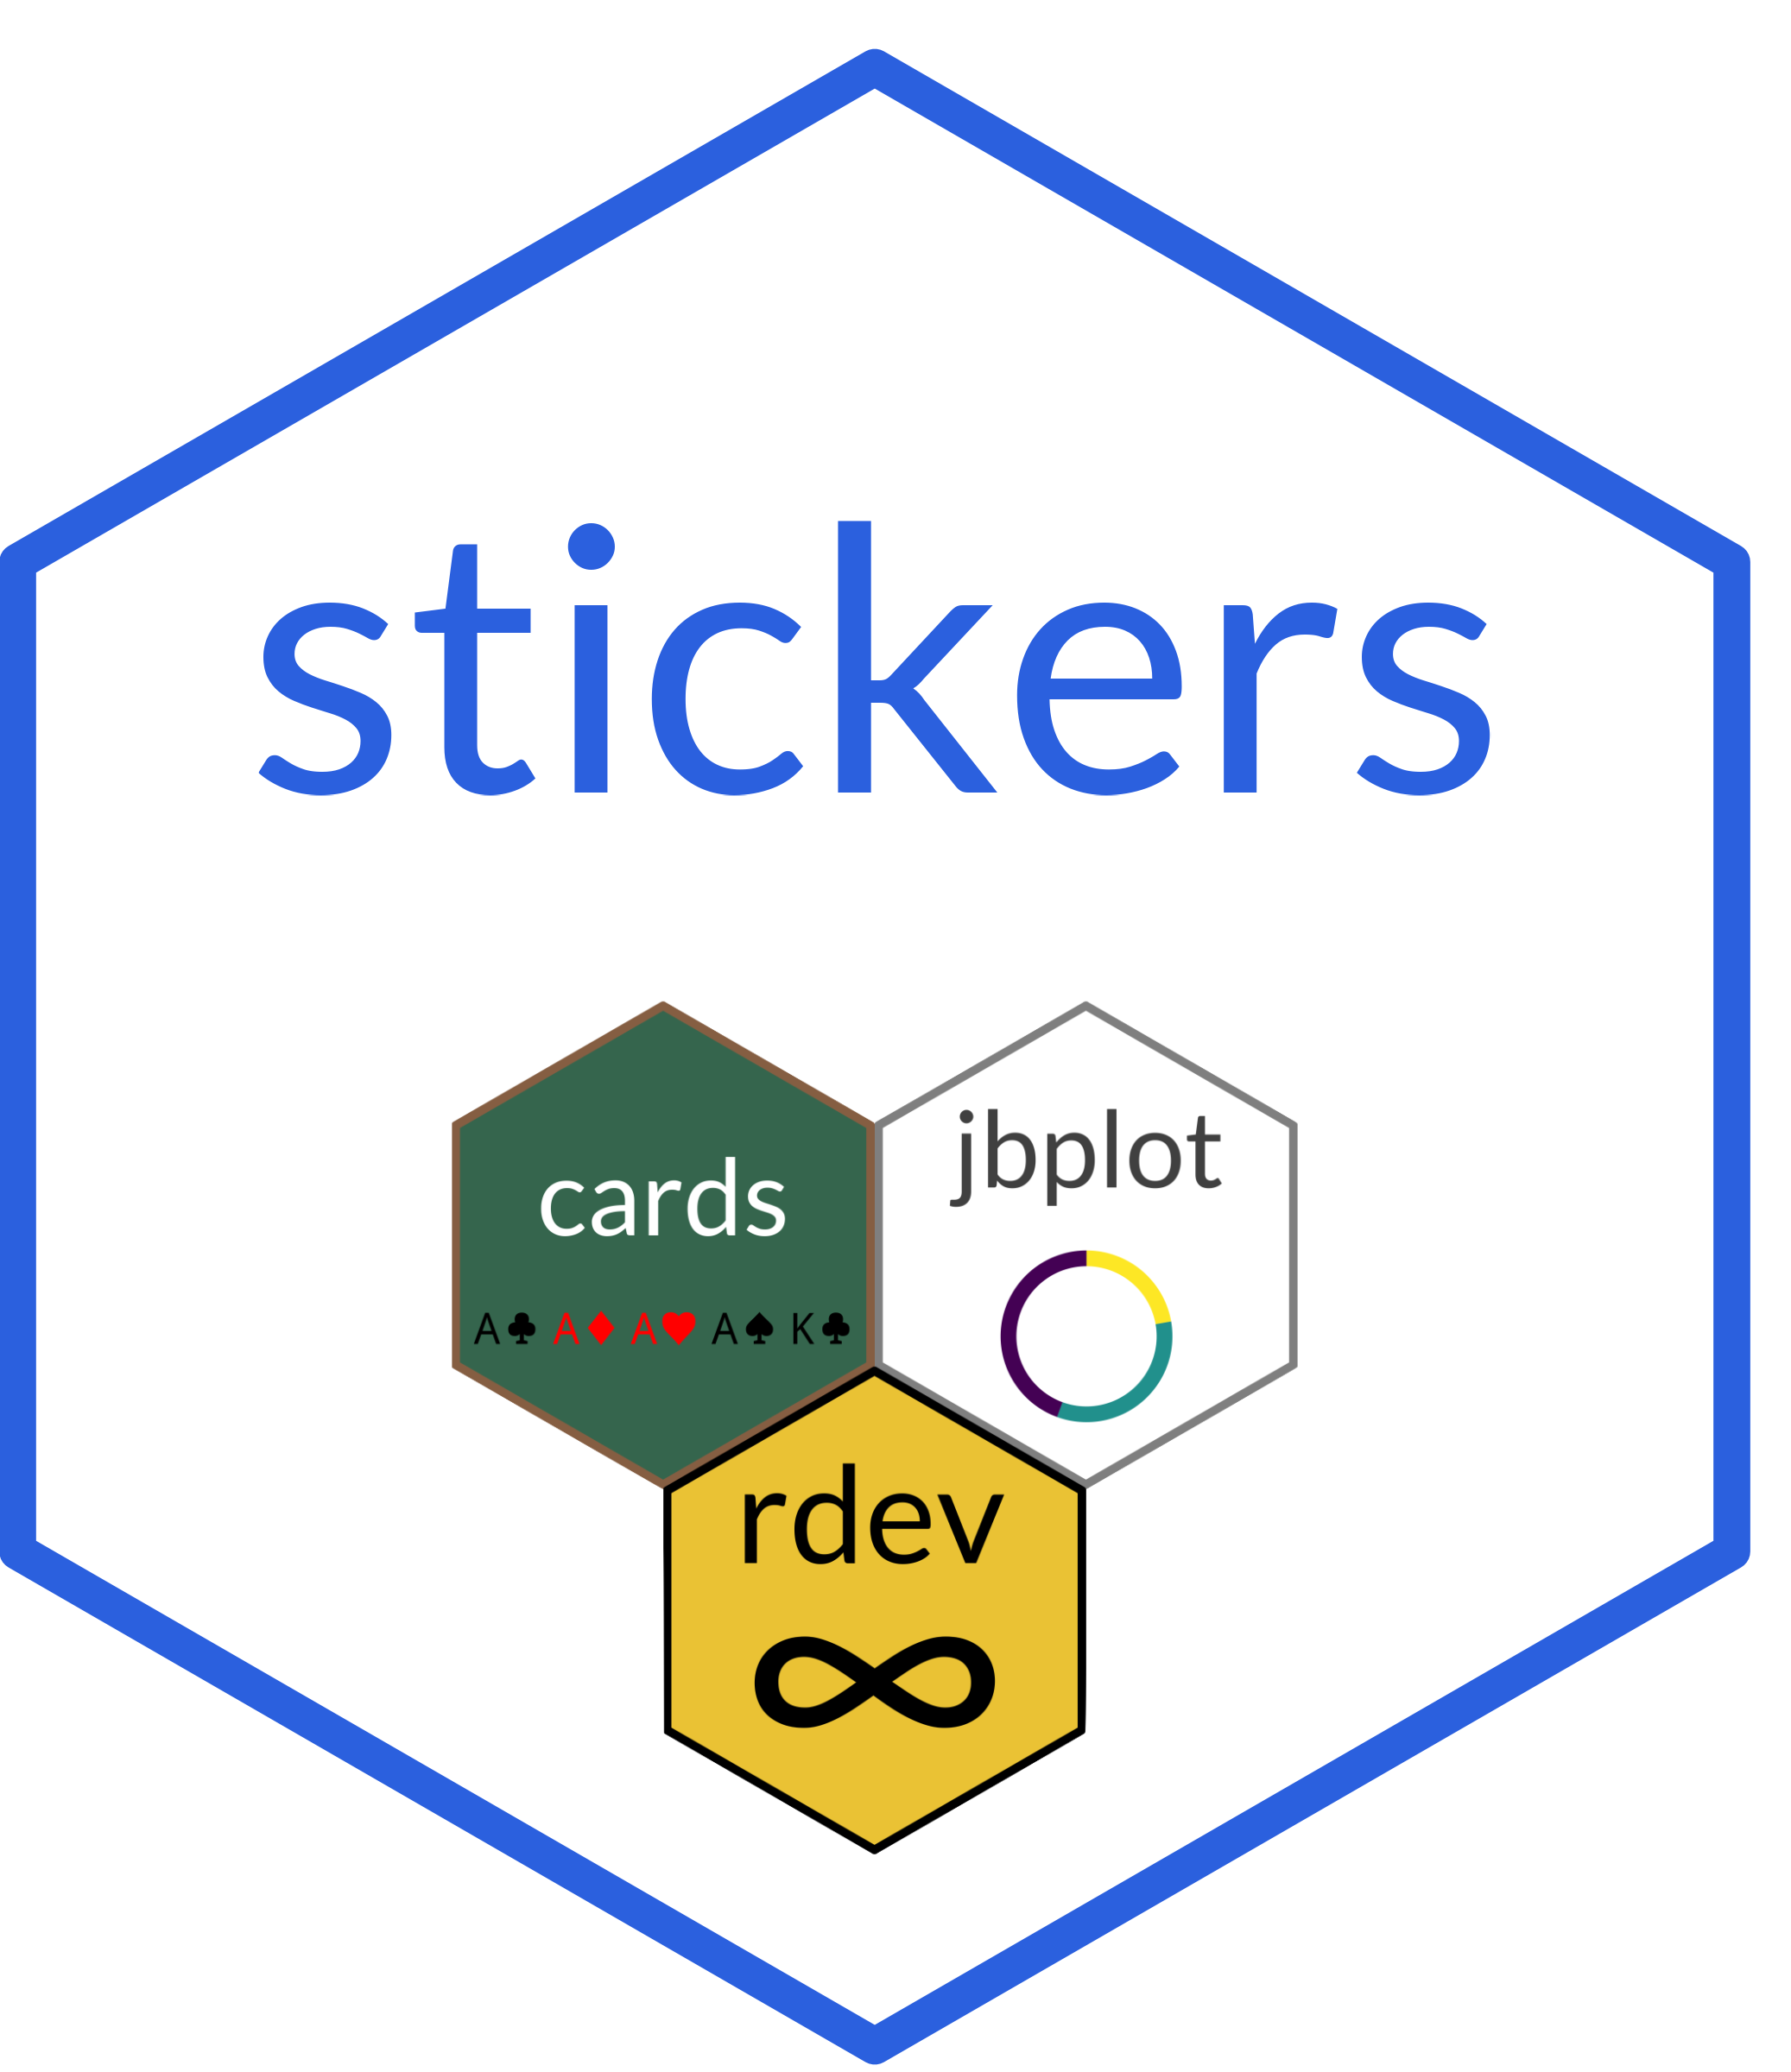
stickers
Stickers image built with the hexwall script. The sticker background is a neutral white. The border and title are Royal Blue.
hexwall("analysis/rendered", sticker_row_size = 2)The hexwall.png file was edited to change the white background to transparent.
sticker(
  "assets/hexwall.png",
  s_x = 1,
  s_y = 0.625,
  s_width = 0.4,
  s_height = 0.4,
  package = "stickers",
  p_color = "#2B60DE",
  p_family = "Lato",
  p_size = 18,
  h_fill = "white",
  h_color = "#2B60DE",
  filename = "rendered/stickers.png",
  dpi = 1200
)
Rendered file: