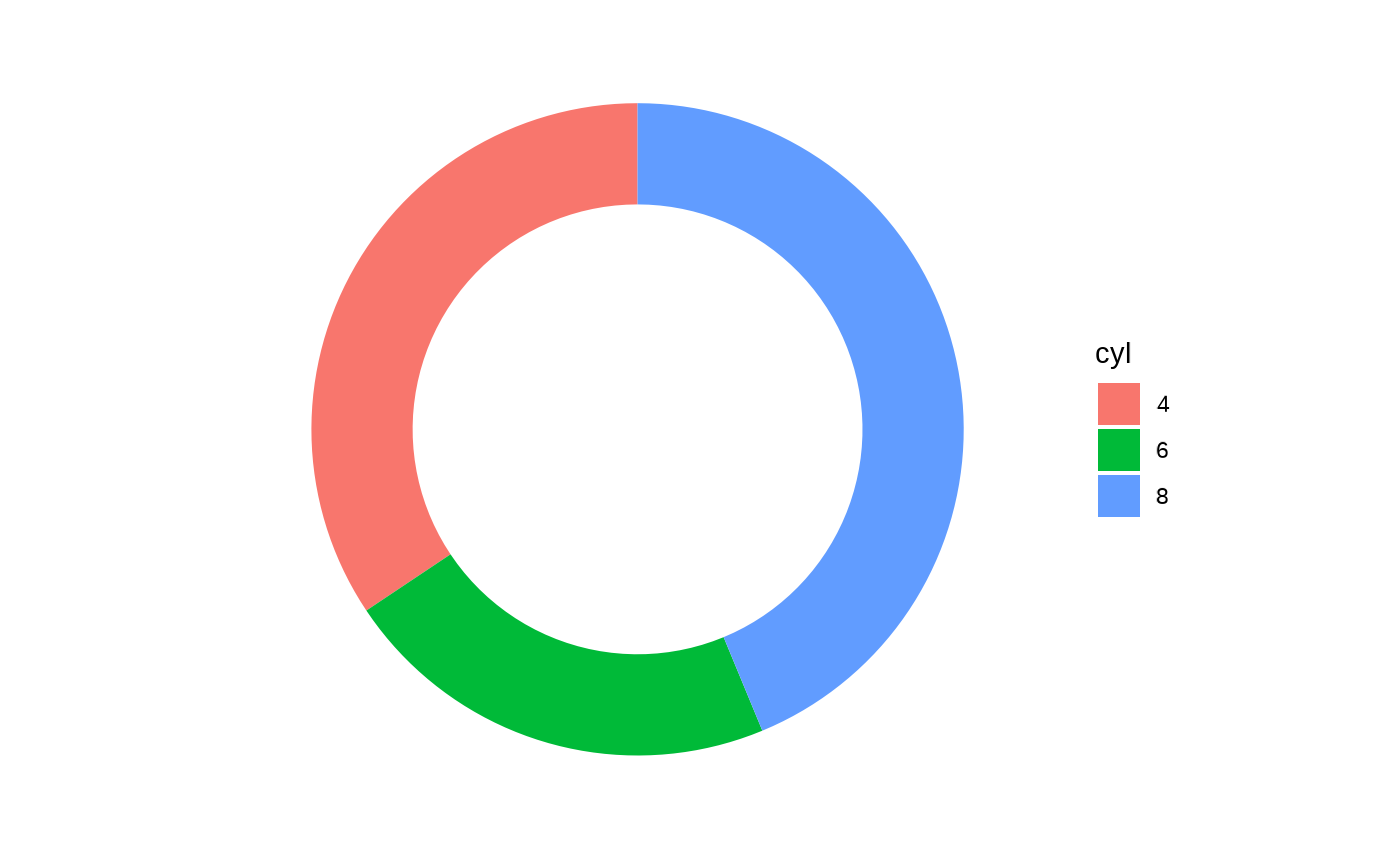
Create a donut plot from a data frame containing groups and corresponding values with
ggplot2::ggplot().
Arguments
- data
Default dataset to use for plot. If not already a data.frame, will be converted to one by
fortify(). If not specified, must be supplied in each layer added to the plot.- group
Name of column to use for the plot colors.
- value
Name of column to use for the sector size.
- hsize
Size of the donut hole. Defaults to
2, and must be a non-negative value. A value of0creates a pie chart.
Details
Implemented using ggplot2::geom_col(), ggplot2::coord_radial(), and ggplot2::xlim(),
adapted from guides in
The R Graph Gallery and
R CHARTS.
Some default plot elements are disabled using ggplot2::theme() and ggplot2::element_blank().